|
|
Follow the Middle East Forum
|
|
Related Articles
How Many Qatari
Nationals Are There?
|
|||||||||||||||||||||||||||||||||||||||||||||||||||||||||||||||||||||||||||||||||||||||||||||||||||||||||||||||||||||||||||||||||||||||||||||||||||||||||||||||||||||||||||||||||||||||||||||||||||||||||||||||||||||||||||||||||||||||||||||||||||||||||||||||||||||||||||||||||||||||||||||||||||||||||||||||||||||||||||||||||||||||||||||||||||||||||||||||||||||||||||||||||||||||||||||||||||||||||||||||||||||||||||||||||||||||||||||||||||||||||||||||||||||||||||||||||||||||||||||||||||||||||||||||||||||||||||||||||||||||||||||||||||||||||||||||||||||||||||||||||||||||||||||||||||||||||||||||||||||||||||||||||||||||||||||||||||||||||||||||||||||||||||||||||||||||||||||||||||||||||||||||||||||||||||||||||||||||||||||||||||||||||||||||||||||||||||||||||||||||||||||||||||||||||||||||||||||||||||||||||||||||||||||||||||||||||||||||||||||||||||||||||||||||||||||||||||||||||||||||||||||||||||||||||||||||||||||||||||||||||||||||||||||||||||||||||||||||||||||||||||||||||||||||||||||||||||||||||||||||
|
|
|
Share:
|

Qatari
demographic policy is aimed at achieving a high population growth by
encouraging a high natural increase rate. Qatar has no income tax, and its
citizens are recipients of generous subsidies and extensive social welfare
programs, many of which are meant to encourage marriages and large
families. These include providing loans for housing, reducing the cost of
dowries, and giving family allowances that increase according to the number
of children per couple.
|
While none of the Gulf Cooperation Council (GCC) states[1] have ever published the religious composition of their indigenous populations, Qatar has lagged further behind: It does not even make public the total size of its indigenous population, considered "a national secret." As the online editor of a Qatari-based business publication was told when approaching the Qatar Statistics Authority (QSA) for the data: "We regret to inform you that the required data is not available."[2]
Until the early 1980s, the Qatari authorities did not in fact have complete demographic data of their indigenous population. Since then, and certainly following the implementation of the 1986 census, this data has been comprehensive and accurate and deliberately hidden. Why are the Qatari authorities not publishing the basic data on the number of their citizens as do all other countries? The reason for this, it seems, is quite simple: The national population is too small to match the country's political needs and aspirations. Since Qatar prefers not to naturalize vast numbers of foreigners, including Arab Sunnis, the only option has been to hide the small size of the national population through the evasive pretense of not having the data. The principal aim of this article is to explore this "secret."
Population Growth
in Qatar
The first estimate of Qatar's population made by John Gordon Lorimer of
the British Foreign Office in 1904 put the emirate's total population at
approximately 27,000.[3]
Before the discovery of oil, pearl fishing was the emirate's economic
mainstay; however, the development of the Japanese cultured pearl industry at
the beginning of the 1930s, together with the Great Depression, and the onset
of World War II led to a severe economic recession and an attendant sharp decline
in Qatar's population to some 16,000 by the mid-1940s.[4] The beginning of oil exports in
1949 reversed this economic trend. Consequently, more and more people entered
the emirate, and by 1950, Qatar's total population was estimated at
approximately 25,000-30,000.[5]The first Qatari census, taken in 1970, put the indigenous population at 45,039.[6] However, since it was assumed by those who implemented the census that the under-enumeration (mainly of females and children) of that census was approximately 6 percent,[7] it seems that the number of Qatari citizens at the time was closer to 47,700 (see Table 1).
According to an estimate by demographers J. S. Birks and C. A. Sinclair, by 1975, Qatar's national population numbered 60,300 (see Table 1), a rise of 34 percent from the 1970 official census result.[8] This rapid population growth could not be the result of natural increase (i.e., births minus deaths) alone as it would require the unlikely annual average natural increase rate of 4.8 percent. Since Qatar's crude death rate (CDR) in the early 1970s was approximately 18-20 per 1,000 people (see Table 3), this means that in order to achieve a natural increase rate of 4.8 percent, the crude birth rate (CBR) would have to be more than 65 per 1,000, which is unreasonable (see Table 3). Thus, taking into consideration a natural increase rate of about 3.2 percent on an annual average during the first half of the 1970s, Qatar's indigenous population in 1975 should have totaled some 56,000, about 4,300 fewer than Birks and Sinclair's estimate.
Since the Qatari naturalization policy at that time was very strict, it is implausible that the authorities would have naturalized more than 4,000 immigrants, namely 7-8 percent of the total Qatari citizenship, within a period of only five years. The only alternative for evaluating Birks and Sinclair's 1975 estimate and that of the U.N. Economic Commission for Western Asia's (ECWA), which estimated Qatar's nationals at 65,357 in 1980 (see Table 1), is to find the number of Qatari citizens in the March 1986 census and implement a "back projection" method.
In 1985, HRD Base Ltd., a subsidiary of Lloyds Bank, estimated Qatar's indigenous population at 84,240, namely 29 percent higher than the 1980 ECWA estimate. The nominal natural increase, namely the surplus of live births over deaths during the 1980-85 period was 15,689 (see Table 3), representing an increase of 24 percent over the ECWA estimate. This expresses a difference of 3,200 people between ECWA's estimate of 1980 plus the natural increase of 1981-85 period and the estimate of HRD for 1985. This gap could be explained by the naturalization of foreign women married to Qatari nationals—a very common phenomenon, which the Qatari government highly encouraged—as well as by adding some unrecorded births, reflecting the fact that Qatar's civil registration system had then been in its infancy.
The problem, however, is with the March 1986 census results. According to official Qatari data, Qatari nationals fifteen years and older numbered 54,502 (26,878 of whom were males and 27,624 females).[9] According to figures from the U.N. Economic and Social Commission for Western Asia (ESCWA, formerly ECWA), Qatari nationals in the 1986 census totaled 101,859 (see Table 1). This figure implies that Qataris under the age of fifteen constituted 46.5 percent of the total Qatari citizens—a rate which is plausible based on the extremely wide-based age pyramid of the Qatari indigenous population due to the high natural increase rates during the 1970s and the first half of the 1980s.
However, it is unlikely that in one year—between mid-1985 and March 1986—the number of Qatari citizens increased by 17,619 people. Moreover, if there was a massive naturalization of women who married Qatari nationals between the 1970 and the 1986 censuses, the number of Qatari women twenty years of age and older in the 1986 census data should have been much higher than that of males. This, however, was not the case. According to the census results, the number of females twenty and older was fewer than 1,000 above that of males (21,670 females and 20,734 males).[10] Data calculated from official Qatari statistics on the rate and the nominal number of the natural increase puts the total number of Qatari citizens at 91,979 in 1984, growing to 99,642 in 1986, namely, 2,217 less than ESCWA's figure (see Tables 1 and 2).
|
With the absence of data on
naturalization, it is impossible to evaluate the number of Qatari nationals
between the 1970 and 1986 censuses. |
A clear indicator of this large-scale naturalization of women of childbearing age is the sharp increase in the number of births, which grew from 2,853 in 1980 to 4,034 in 1986. This means that in six years alone, the number of live births increased by as much as 41.4 percent. Taking into consideration that during that period the total fertility rate (TFR, average number of children born to a woman during her lifetime) not only did not increase but rather substantially decreased, the only logical explanation for the rapid growth in the number of live births was due to a substantial increase in the number of women of childbearing age. However, due to the absence of any data regarding naturalization in Qatar, it is impossible to evaluate the number of Qatari nationals during the period between the 1970 and 1986 censuses.
Moving forward in time, according to the 1997 census results, Qatari nationals aged 15- years old and above numbered 84,902[11] while those aged ten and above numbered 103,273.[12] The number of live births minus infant deaths (children under the age of 1) during the decade prior to the census implementation was 48,498 (see Table 4a). If we assume 0 emigration of the 0-10 age group and 0 mortality of children in the 1-10 age group, this amounts to total Qatari citizens of 151,771 with the under-10 age group representing 32 percent of the total population—a plausible percentage given Qatar's natural increase patterns at that time.
Comparing the 1986 census results to those of 1997 indicates a nominal increase of 49,912. The nominal gap between the 1986 and 1997 data is almost identical to the natural increase between the two censuses, which numbered 48,266.[13] The small gap of 1,650 people between the natural increase and the actual growth is probably due to the naturalization of foreign women, which also explains the small surplus of females over males identified in the 1997 census data in the age group of 15-years and above.[14] Since no official Qatari data is available on either the scale or the timing of the naturalization, it is reasonable to distribute the 1,650 surplus equally across the entire period between the two censuses. Thus, adding 150 to the natural increase each year during the eleven years between the two censuses produces the exact increase throughout the period between the two censuses.
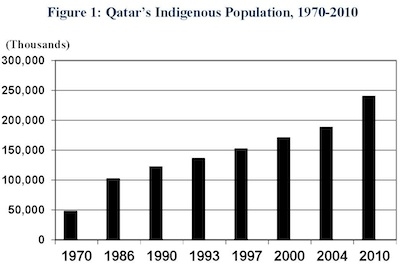
By the time of the March 2004 census, the Qatari authorities were publishing data regarding citizens 3-years old and above (168,958).[15] By adding live births minus infant deaths during the three years prior to the implementation of this census (19,059),[16] one arrives at a total figure for the Qatari indigenous population of 188,017 (see Table 1).
Measuring the natural increase between the 1997 and the 2004 censuses suggests the figure of 36,748.[17] Thus, the 1997 census results plus the natural increase between the two censuses suggest 188,519, namely, 500 more than the actual 2004 census results—an insignificant number that is probably due to some deaths of nationals in the 1-10-age group and some misreporting or errors in the censuses. The calculated number according to the Qatari natural increase data suggests the figure of 194,092 in mid-2004 (see Table 1) which is about 3 percent higher than this author's calculation for the census results. This gap could be attributed to the fact that there are three and a half months between the census implementations, namely between mid-March, and mid-year (end of June). Another reason is that the rate of the natural increase provided by the QSA is not totally accurate as it includes only one digit after the decimal point.
|
In 2005, the Qatari authorities
revoked the citizenship of 6,000 members of the Murrah tribe on suspicion
of disloyalty to the emir. |
However, a curious and significant anomaly emerges. This is because adding the natural increase between the two censuses (38,641)[19] to the 2004 census data yields 226,658, namely, 13,384 less than the actual 2010 census results. This substantial gap could not be explained by an under-enumeration of births. This is not only due to the fact that since 2000, the Qatari civil registration system has been totally computerized but also because Qatari parents have had every reason to register new births due to various benefits granted by the government for every Qatari newborn. Moreover, because of the short time between the two censuses, it is quite easy to compare age groups in these two censuses.
Under a condition of "zero naturalization and migration balance," i.e., the natural increase only, the number of Qatari citizens in the age group of 4-58 from the 2004 census should have been close to identical to the 10-64 age group in the 2010 census.[20] In reality, however, while the 4-58 age cohort in the 2004 census numbered 155,024,[21] the 10-64 age group in the 2010 census numbered 166,932,[22] about an extra 12,000 people.
The unexplained gap between the two censuses could not be justified by the matter of the al-Murrah tribe, when in March 2005, the Qatari authorities revoked the citizenship of about 6,000 members on suspicion of disloyalty to the emir. This is because their citizenship had already been returned in February 2006. Thus, both revoking and returning their citizenship occurred during the period between the two censuses.[23]
Thus, while the difference in the number of Qatari citizens between the 1970 and the 1986 censuses could be explained at least partially by an under-enumeration of births at a period when the Qatari civil registration system was just beginning, this was certainly not the case in the period between the 2004 and the 2010 censuses. The only plausible conclusion is that, during the period between these two censuses, there was a massive naturalization of about 13,400 people, representing approximately 5.6 percent of the country's citizens in the 2010 census.
The Qatari natural increase data also indicates massive naturalization during the period between the two censuses, particularly in 2007 and 2008. While according to the calculations based on the Qatari natural increase data, the number of Qatari nationals increased from 215,199 in mid-2007 to 232,267 in mid-2008, the actual natural increase in those twelve months was less than 7,000 (see Tables 2 and 3), namely, about 10,500 less than the actual growth. However, since it is not clear when this large-scale naturalization actually occurred, it is reasonable to divide the "extra" growth beyond the natural increase equally across the 6-year period between the two censuses.
Qatar's
Naturalization Policy
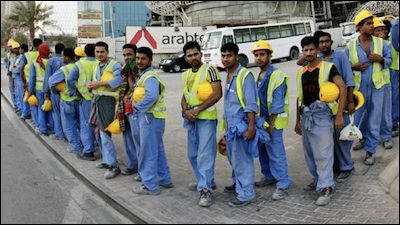
Some
analysts estimate that 88 percent of Qatar's population is made up of
migrant workers. But Qatar has made no progress in abolishing laws that
effectively force foreign workers into slavery.
|
Thus, in each of the Gulf oil states, the authorities enacted laws to prevent the naturalization of foreign workers, even Sunni Arabs and even if they had lived in the country for decades. Nor would birth in one of the Gulf states entitle newborns to citizenship or even permanent residency.[25] The naturalization laws in each of these states are so strict that even marriage of a foreign male to a Gulf female does not grant citizenship to the husband. On the other hand, a foreign woman who marries a Gulf male does become a citizen of the host country. This difference is due to the fact that according to the Shari'a (Islamic law), the religion of children follows that of the father. Therefore, the vast majority of non-natives who have received citizenship in these countries are females married to GCC males. Only in exceptional circumstances have the authorities granted citizenship to a male foreigner; their number, in any case, was insignificant.[26]
In the case of Qatar, before the Citizenship Act (No. 38) of 2005, foreigners were granted citizenship solely at the emir's discretion. The new act provides for the first time a legal mechanism by which a foreigner can apply for Qatari citizenship. According to the new law, Qatari citizenship may be obtained for those who fulfilled the following conditions: (a) residency in Qatar for at least twenty-five consecutive years; (b) the ability to speak Arabic; (c) a clean criminal record; and (d) a lawful means of income. In addition to these conditions, those born to a naturalized Qatari father shall be deemed a naturalized Qatari. The new law, however, limits the number of those to be granted Qatari citizenship to only fifty annually.[27]
It should be noted in this respect that the Qatari authorities regularly insisted that the number of those who acquired citizenship in this fashion was very small. Thus, for example in a 2010 interview, Qatari emir Sheikh Hamad stated: "A policy to increase the population; we don't have this actually. But we give [citizenship] for the people first who apply and who fulfill our own regulations. Until now there are not many who are asking."[28]
While official Qatar followed the common naturalization policy of the other GCC states with the majority of those receiving citizenship being foreign women married to Qatari nationals, evidence indicates that a substantial number of foreign males also succeeded in receiving Qatari citizenship.
Recently, Qatar apparently started a new process of naturalization of Bahraini Sunnis.[29] However, as it probably began following the implementation of the 2010 census, this process is beyond the scope of this article. Moreover, since the latest publication of vital statistics annual bulletins of the QSA is from 2011, it is impossible to try to evaluate the scale of the Qatari national population following the 2010 census.
Engineered
Natural Increase
But whatever the number of naturalized citizens in Qatar, the major
contributor to the rapid growth of the indigenous Qatari population since the
1970s has been natural increase.

Qatar
University College of Pharmacy. Eighteen female pharmacy students receive
their bachelor of science degrees from Qatar University College of
Pharmacy, November 30, 2011. It is probable that the decline in the
fertility rate of Qatari women has been due to both a substantial increase
in the number of indigenous females receiving post-secondary education and
to delayed marriages.
|
Like other Gulf oil states, Qatar's natural increase rate rose rapidly following the onset of the oil boom, due to a sharp decline in CDR as greater oil revenues translated, in part, into better health services and a sharp rise of living standards. According to ECWA's estimate, in 1980, Qatar's natural increase rate climbed to 4.1 percent (with a CBR of 51 and a CDR of 10);[31] an average of 3.7 percent annual increase during the second half of the 1970s can, therefore, be reasonably assumed.
Due to its nearly exclusive reliance on oil revenues, Qatar fits the classic model of a rentier state, that is, a country that receives a considerable portion of its national revenues from the sale of its natural resources to external clients. Qatar has no income tax, and its citizens are recipients of generous subsidies and extensive social welfare programs. As a result, Qatar is pro-natalist by its very nature, like other rentier states.
|
Since more than 80 percent of Qatari
males work in the public sector, family allowances are, in effect, granted
to almost all citizens. |
The impact of these measures can be seen in the demographic data. In total contrast to what would be expected in line with the "demographic transition theory" (i.e., after a sharp decline in death rates, fertility rates decline substantially), during the 1980s, and particularly in the second half of the decade, despite a sharp decline in infant and child mortality rates and the rapid increase in life expectancy, the fertility rate of indigenous Qatari women only declined slightly. By 1986, the total fertility rate of indigenous Qatari females was 5.8 (see Table 6), a rate much lower than it had been a decade earlier but still very high in comparison to other Arab countries.[34]
This pattern continued through the 1990s when despite great improvements in both healthcare and educational services (which led, in effect, to healthcare indicators similar to those of the developed world), Qatar's fertility rates remained very high. By 1997, the total fertility rate was 5.8, identical to 1986. While the significant improvement in these services led to a substantial delay in first births, their cumulative number remained the same (see Table 6).
This trend ended, however, by the early 2000s with the fertility rate of Qatari women gradually declining to 3.4 in 2012. It is probable that this decline, marked especially by the drop in births to women under the age of twenty-four, was due to both a substantial increase in the number of indigenous females receiving post-secondary education and to delayed marriages.[35]
At least by 2004, the Qatari authorities had acknowledged the problem and established the Permanent Population Committee (PPC) to promote higher fertility. Its main objective was to, "Raise the current natural population increase rate for nationals, or at least maintain it to achieve an appropriate balance among Qatar's total population."[36] In its 2011 annual report, the committee specifically declared that the main objective of Qatar's population policy was to "increase the proportion of citizens among [the] total population."[37] This aim was to be achieved mainly through encouraging and facilitating marriages among Qatari citizens; the adoption of policies that would reduce delayed marriage, especially of girls; facilitating the remarriage of divorcees and widows; providing loans for housing; reducing the cost of dowries, and giving family allowances that would increase according to the number of children per couple.[38] In addition to these financial incentives, the Qatari authorities have recruited prominent religious figures who constantly emphasize the religious duty of marriage and childbearing.
Future
Forecasts
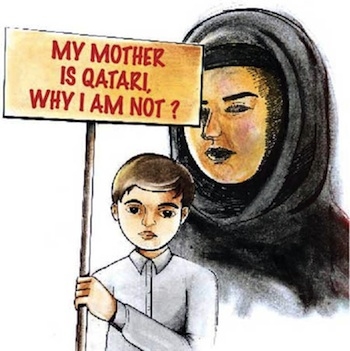
Birth
in Qatar does not entitle newborns to citizenship; the marriage of a
non-Qatari male to a Qatari female does not grant citizenship to the
husband or to the child. As a result, these children are denied privileges
such as free electricity and water, subsidized food products, free
education, and government jobs set aside for nationals.
|
The failures of these projections were largely due to two factors: First is the impossibility of predicting Qatar's high demand for foreign labor, even in the short run. The country's economic development during the past decade has been unique—even among the GCC countries—with a real GDP growth rate of 17.7 percent in 2008, dipping to 12 percent in 2009, and then accelerating to the incredible level of 16.6 percent in 2010.[44] In 2012, Qatar's per capita GDP was the highest worldwide, amounting to more than $102,000 (in purchasing power parity terms).[45] This rapid economic expansion was accomplished through the massive import of foreign workers who were the main contributors to Qatar's population increase during the past two decades. The second factor for the demographic projections failure was the lack of knowledge of the number of Qatari citizens, which made it impossible to predict their nominal growth even in the short run.
|
Despite pro-natalist measures, the
fertility rate of indigenous Qatari women has gradually declined since the
early 2000s. |
The natural increase rate. Despite significant pro-natalist measures, the fertility rate of indigenous Qatari women has gradually declined since the early 2000s. In 2012, the total fertility rate of indigenous Qatari females was quite similar to that of Jordanians and only a little bit higher than in Egypt, both of which had implemented open, anti-natalist policies, at least until the onset of the Arab upheavals. However, in Egypt and Jordan, the total fertility rate is approximately 3.1-3.3 due to a huge difference between low fertility rates in the urban centers and much higher fertility rates in rural and peripheral areas, yielding an average TFR of 3.1-3.3. Qatar's current fertility rate, by contrast, is due to the great financial benefits given to all nationals, which in practice overshadow the various specific, pro-natalist incentives. What else can the Qatari government give its nationals in order to increase their fertility rate? In other words, Qatar, as the most rentier state worldwide, has no more "carrots" for encouraging its nationals to increase their fertility level. Thus, Qatar's current TFR is probably at the highest level possible under the current rentier system while in Egypt and Jordan, for example, the fertility level is more elastic and could rise or decline, in line with the natalist policy. Consequently, Qatar's fertility rate is projected to stabilize at 3.0-3.2 for the foreseeable future.
The age pyramid. However, even if the fertility rate continues to decline to less than three children due to its current, wide-based age pyramid (see Table 5), Qatar's indigenous population will continue to increase rapidly at least into the foreseeable future—a result of the "demographic momentum" phenomenon, i.e., the tendency for a population to continue to grow because the number of women of reproductive age will continue to increase for a number of decades before finally stabilizing. Therefore, it is reasonable to predict an average natural increase rate of 2.6-2.7 percent for the coming decade and approximately 2.3-2.5 percent for the decade following. The natural increase rate of the indigenous Qatari population is expected to go down not only due to declining fertility rates but because of an increasing crude death rate as the percentage of the elderly population naturally increases due to the sharp decline of the fertility rates since the early 2000s.
The naturalization scale. Among the three components, this is the least knowable. This is the case not only because Qatari authorities have not published any data on naturalization but also because, as previously discussed, naturalization in Qatar occurred in two large, unexpected waves that had hitherto been undetected. Thus, if there is a next large-scale naturalization, it will probably also be unexpected and consequently unpredictable.
Despite the fact that the latest publication of the annual bulletin of vital statistics of the QSA is from 2011 and that the scale of naturalization since the 2010 census is unknown, it would be reasonable to assume that the number of Qatar's citizens has increased by about 4 percent annually since the implementation of the 2010 census. Thus, one can conclude that in early 2015, the number of Qatar's citizens will total approximately 290,000 and will increase to about 440,000-470,000 in 2030.
Conclusions
Achieving high population growth by encouraging a high natural increase
rate was and still is the basic demographic policy of the Qatari authorities.
In this respect, the emirate is no different from other GCC states, such as
the United Arab Emirates and Kuwait. However, both censuses and official
natural increase data indicate that the Qatari population grew significantly
also due to two waves of naturalization.Who are these "new Qataris"? Was this mass naturalization a consequence of a huge labor shortage? Unfortunately, the Qatari authorities have barely mentioned the issue of naturalization and have never acknowledged any form of mass naturalization.
Qatar may continue to act according to its current super rentier policies due to its huge per capita income. It has also enjoyed unusual economic growth for a GCC country as the result of a rapid increase in liquefied natural gas exports and a massive development of infrastructure. It remains to be seen how the new emir, Sheikh Tamim, will run the country with a much larger indigenous population and with a much larger national workforce which cannot be employed almost exclusively in the public sector, as is currently the case.[46]
Onn Winckler is associate professor in the department of Middle Eastern History, University of Haifa, specializing in political demography and economic history of the Arab countries. The author thanks Noa Josef and Fany Pesahov for their assistance in data.
Table 1:
Alternative Estimates of Qatar's Indigenous Population, 1970-2010
|
Year
|
Semi-official and
unofficial estimates |
Author's calculation
of total Qatari citizens according to the NI data (mid-year)** |
Author's estimate
|
|||
|
1970
(c)
|
45,039(c)
|
--
|
47,700(c)
|
|||
|
1975
|
60,300
|
--
|
--
|
|||
|
1980
|
65,357(so)
|
--
|
--
|
|||
|
1984
|
--
|
91,979
|
--
|
|||
|
1985
|
84,240
(un)
|
95,698
|
--
|
|||
|
1986
(c)
|
99,754
(uo) /101,859 (so)
|
99,642
|
101,859(c)
|
105,340*
|
||
|
1987
|
--
|
103,594
|
109,064*
|
|||
|
1988
|
--
|
107,533
|
113,268*
|
|||
|
1989
|
--
|
111,639
|
117,504*
|
|||
|
1990
|
103,400(uo)
|
116,081
|
121,949*
|
|||
|
1991
|
--
|
120,461
|
126,279*
|
|||
|
1992
|
141,000(uo)
|
124,820
|
130,935*
|
|||
|
1993
|
--
|
129,735
|
135,976*
|
|||
|
1994
|
128,986(so)
|
134,861
|
140,981*
|
|||
|
1995
|
--
|
140,440
|
145,920*
|
|||
|
1996
|
133,450(so)
|
145,670
|
150,848*
|
|||
|
1997
(c)
|
151,673(uo)
|
151,624
|
151,771(c)
|
155,664*
|
||
|
1998
|
142,341(so)
|
157,573
|
160,533*
|
|||
|
1999
|
--
|
163,388
|
165,500*
|
|||
|
2000
|
152,449(so)
|
173,514
|
170,636*
|
|||
|
2001
|
--
|
179,867
|
176,032*
|
|||
|
2002
|
--
|
184,983
|
181,415*
|
|||
|
2003
|
--
|
190,435
|
187,109*
|
|||
|
2004
(c)
|
192,586(uo)
|
194,092
|
188,017(c)
|
194,390*
|
||
|
2005
|
--
|
202,222
|
202,385*
|
|||
|
2006
|
--
|
209,120
|
210,510*
|
|||
|
2007
|
--
|
215,199
|
219,269*
|
|||
|
2008
|
--
|
232,267
|
228,509*
|
|||
|
2009
|
--
|
--
|
237,590*
|
|||
|
2010
(c)
|
280,000-300,000
(Gray)/
250,000 (Kamrava)/ 243,073 (GLMM) |
--
|
240,042(c)
|
245,770*
|
||
|
|
|
|
|
|
|
|
Sources for Semi-official and unofficial estimates: 1970: British Embassy in Beirut, Middle East Development Division, by N.B. Hudson, The First Population Census of Qatar, Apr./May 1970 (Beirut, Oct. 1970), p. 17; 1975 (uo): J.S. Birks and C.A. Sinclair, International Migration Project, Country Case Study: The State of Qatar (University of Durham, Department of Economics, February 1978), table 1, p. 6; 1980 (so): ECWA, Demographic and Related Socio-Economic Data Sheets for Countries of the ECWA, No. 3 (Beirut, May 1982), table 1, p. 131; 1985 (uo): HRD Base Ltd., Lloyds Bank Chambers, Socio-Demographic Profiles of Key Arab Countries (Newcastle, May 1987), table 1, p. 151; 1986 (so): ESCWA, Population Situation-1990, table 9.1, p. 153; 1986 (uo): Gulf Labour Markets and Migration (GLMM).; 1990 (uo): Birks, Sinclair & Associates Ltd., GCC Market Report-1990 (Durham: Mountjoy Research Centre, May 1990), table 1.1, p. 108; 1992 (uo): Birks, Sinclair & Associates Ltd., GCC Market Report-1992 (Durham: Mountjoy Research Centre, 1992), table 1.1, p. 82; 1994 (so): ESCWA, Demographic Data Sheets, No. 8 (1995), table 1, p. 92; 1996 (so): ESCWA, Demographic Data Sheets, No. 9 (1997), table 1, p. 84; 1997 (uo): Gulf Labour Markets and Migration (GLMM). Available at: http://gulfmigration.eu/population-by-nationality-qatari-w-census-1970-2010; 1998 (so): ESCWA, Demographic Data Sheets, No. 10 (1999) table 1, p. 83; 2000: ESCWA, Demographic Data Sheets, No. 11 (2001), table 1, p. 116; 2004 (uo): Gulf Labour Markets and Migration (GLMM); 2010 (uo): Matthew Gray, Qatar: Politics and the Challenge of Development (Boulder, CO.: Lynne Rienner, 2013), p. 222;Mehran Kamrava, Qatar: Small State, Big Politics (Ithaca and London: Cornell University Press, 2013), p. 5; Gulf Labour Markets and Migration (GLMM).
Table 2:
Calculated Total Qatari Citizens through the Official Qatari Natural Increase
Data, 1984-2008
|
Year
|
CBR
(per 1,000) |
Nominal number
of live births |
CDR
(per 1,000) |
Nominal number
of deaths |
NI
(per 1,000) |
Nominal number
of NI |
Author's calculation
of total Qatari citizens according to the NI data (mid-year)** |
|
1984
|
41.4
|
3,812
|
3.5
|
326
|
37.9
|
3,486
|
91,979
|
|
1985
|
40.3
|
3,857
|
4.5
|
431
|
35.8
|
3,426
|
95,698
|
|
1986
|
40.4
|
4,034
|
4.2
|
417
|
36.3
|
3,617
|
99,642
|
|
1987
|
38.5
|
3,991
|
4.0
|
417
|
34.5
|
3,574
|
103,594
|
|
1988
|
41.5
|
4,472
|
3.9
|
418
|
37.7
|
4,054
|
107,533
|
|
1989
|
40.4
|
4,513
|
3.8
|
427
|
36.6
|
4,086
|
111,639
|
|
1990
|
40.7
|
4,724
|
3.7
|
429
|
37.0
|
4,295
|
116,081
|
|
1991
|
38.9
|
4,691
|
4.2
|
511
|
34.7
|
4,180
|
120,461
|
|
1992
|
40.1
|
5,016
|
4.1
|
510
|
36.1
|
4,506
|
124,820
|
|
1993
|
41.5
|
5,389
|
3.8
|
498
|
37.7
|
4,891
|
129,735
|
|
1994
|
39.8
|
5,373
|
3.8
|
518
|
36.0
|
4,855
|
134,861
|
|
1995
|
38.1
|
5,344
|
4.0
|
555
|
34.1
|
4,789
|
140,440
|
|
1996
|
36.4
|
5,306
|
3.6
|
528
|
32.8
|
4,778
|
145,670
|
|
1997
|
35.0
|
5,312
|
3.6
|
551
|
31.4
|
4,761
|
151,624
|
|
1998
|
34.6
|
5,446
|
3.7
|
577
|
30.9
|
4,869
|
157,573
|
|
1999
|
34.1
|
5,575
|
3.7
|
608
|
30.4
|
4,967
|
163,388
|
|
2000
|
33.3
|
5,750
|
3.6
|
614
|
29.6
|
5,136
|
173,514
|
|
2001
|
33.5
|
6,014
|
3.5
|
618
|
30.0
|
5,396
|
179,867
|
|
2002
|
32.8
|
6,047
|
3.7
|
664
|
29.1
|
5,383
|
184,983
|
|
2003
|
33.2
|
6,312
|
3.3
|
618
|
29.9
|
5,694
|
190,435
|
|
2004
|
33.7
|
6,538
|
3.4
|
657
|
30.3
|
5,881
|
194,092
|
|
2005
|
31.3
|
6,324
|
3.4
|
682
|
27.9
|
5,642
|
202,222
|
|
2006
|
31.6
|
6,615
|
3.3
|
676
|
28.4
|
5,939
|
209,120
|
|
2007
|
33.4
|
7,187
|
3.2
|
688
|
30.2
|
6,499
|
215,199
|
|
2008
|
33.0
|
7,621
|
2.9
|
653
|
30.0
|
6,968
|
232,267
|
The formula for calculating: N = E(X) (Under the assumption of a binomial distribution) P; N = Total Qatari citizens; E(X) = The nominal number of the natural increase; P = NI (natural increase) per 1 Qatari citizen. Sources: CBR and CDR: Qatar Information Exchange; Live births and Deaths: Table 3.
Table 3: Natural
Increase Rates in Qatar, 1975-2010 (author's calculations)
|
Year
|
Mid-year
Qatari citizens |
Live births
(nominal number) |
CBR
(per 1,000) |
Deaths
(nominal number) |
CDR
(per 1,000) |
NI
(nominal number) |
NI
(per 1,000) |
Total Fertility Rate
|
|
1975
|
--
|
--
|
50.0
|
--
|
20.0
|
--
|
30.0
|
7.2
|
|
1980
|
--
|
2,853
|
--
|
337
|
--
|
2,516
|
--
|
7.7
|
|
1981
|
--
|
3,002
|
--
|
334
|
--
|
2,668
|
--
|
--
|
|
1982
|
--
|
3,457
|
--
|
373
|
--
|
3,084
|
--
|
--
|
|
1983
|
--
|
3,416
|
--
|
391
|
--
|
3,025
|
--
|
--
|
|
1984
|
--
|
3,812
|
--
|
326
|
--
|
3,486
|
--
|
6.8
|
|
1985
|
--
|
3,857
|
--
|
431
|
--
|
3,426
|
--
|
|
|
1986
|
--
|
4,034
|
--
|
417
|
--
|
3,617
|
--
|
5.8
|
|
1987
|
107,202
|
3,991
|
37.2
|
417
|
3.9
|
3,574
|
33.3
|
--
|
|
1988
|
111,166
|
4,472
|
40.2
|
418
|
3.8
|
4,054
|
36.5
|
5.4
|
|
1989
|
115,386
|
4,513
|
39.1
|
427
|
3.7
|
4,086
|
35.4
|
--
|
|
1990
|
119,727
|
4,724
|
39.5
|
429
|
3.6
|
4,295
|
35.9
|
--
|
|
1991
|
124,114
|
4,691
|
37.8
|
511
|
4.1
|
4,180
|
33.7
|
--
|
|
1992
|
128,607
|
5,016
|
39.0
|
510
|
4.0
|
4,506
|
35.0
|
4.8
|
|
1993
|
133,456
|
5,389
|
40.4
|
498
|
3.7
|
4,891
|
36.6
|
--
|
|
1994
|
138,479
|
5,373
|
38.8
|
518
|
3.7
|
4,855
|
35.1
|
5.0
|
|
1995
|
143,451
|
5,344
|
37.3
|
555
|
3.9
|
4,789
|
33.4
|
--
|
|
1996
|
148,384
|
5,306
|
35.8
|
528
|
3.6
|
4,778
|
32.2
|
--
|
|
1997
|
153,256
|
5,312
|
34.7
|
551
|
3.6
|
4,761
|
31.1
|
5.8
|
|
1998
|
158,099
|
5,446
|
34.4
|
577
|
3.6
|
4,869
|
30.8
|
--
|
|
1999
|
163,017
|
5,575
|
34.2
|
608
|
3.7
|
4,967
|
30.5
|
--
|
|
2000
|
168,068
|
5,750
|
34.2
|
614
|
3.7
|
5,136
|
30.6
|
5.0
|
|
2001
|
173,334
|
6,014
|
34.7
|
618
|
3.6
|
5,396
|
31.1
|
--
|
|
2002
|
178,724
|
6,047
|
33.8
|
664
|
3.7
|
5,383
|
30.1
|
--
|
|
2003
|
184,262
|
6,312
|
34.3
|
618
|
3.4
|
5,694
|
30.9
|
--
|
|
2004
|
190,750
|
6,538
|
34.3
|
657
|
3.4
|
5,881
|
30.8
|
4.2
|
|
2005
|
198,388
|
6,324
|
31.9
|
682
|
3.4
|
5,642
|
28.4
|
3.9
|
|
2006
|
206,448
|
6,615
|
32.0
|
676
|
3.3
|
5,939
|
28.8
|
3.9
|
|
2007
|
214,890
|
7,187
|
33.4
|
688
|
3.2
|
6,499
|
30.2
|
4.0
|
|
2008
|
223,889
|
7,621
|
34.0
|
653
|
2.9
|
6,968
|
31.1
|
3.9
|
|
2009
|
233,050
|
7,499
|
32.2
|
684
|
2.9
|
6,815
|
29.2
|
3.8
|
|
2010
|
241,680
|
7,733
|
32.0
|
673
|
2.8
|
7,060
|
29.2
|
3.6
|
The CBR and CDR were calculated by the average of Qatari citizens each year. For example, the average Qatari citizens in 1998 was their number at the end of 1997 plus their number at the end of 1998 divided by 2 (155,664 + 160,533 : 2 = 158,099).
Sources: Natural increase, 1975: "Available Demographic Socio-Economic Data for Countries of the ECWA Region," Population Bulletin of ECWA, Nos. 10-12 (1978), p. 25; 1980-1982: Vital Statistics Annual Bulletin, 1st Issue, 1984 (Doha: Central Statistical Organization, Sept. 1985), table 2, p. 2; table 19, p. 30; 1983-1992: Vital Statistics Annual Bulletin, 9th Issue, 1992 (Doha: Central Statistical Organization, June 1993), table 2, p. 5; table 25, p. 59; 1993-1999: Vital Statistics Annual Bulletin, 16th Issue, 1999 (Doha: Central Statistical Organization, July 2000), table 2, p. 5; table 25, p. 61; 2000: Vital Statistics Annual Bulletin-2009, 26th Issue (Doha: Qatar Statistics Authority, July 2010), tables10 and 28; 2001-2010: Vital Statistics Annual Bulletin-2010, 27th Issue (Doha: Qatar Statistics Authority, July 2011), table 3; 2011: Annual Statistical Abstract-2012 (Doha: Qatar Statistics Authority, 2013), chapter 3, tables 2 and 10; Total Fertility Rate, The data on the TFR except for the 2005-2007 period is taken from Table 5.; The Data for the 2005-2007 period is taken from: Vital Statistics Annual Bulletin-2009, 27th Issue (Doha: Qatar Statistics Authority, July 2010), table 1.
Table 4a: Qatari
Nationals Ages 0-10 in 1997
|
Year
|
Number of births
|
Number of infant deaths (0-1)
|
Net increase
|
|
1987*
|
3,223
|
48
|
3,175
|
|
1988
|
4,472
|
53
|
4,419
|
|
1989
|
4,513
|
55
|
4,458
|
|
1990
|
4,724
|
54
|
4,670
|
|
1991
|
4,691
|
59
|
4,632
|
|
1992
|
5,016
|
54
|
4,962
|
|
1993
|
5,389
|
62
|
5,327
|
|
1994
|
5,373
|
59
|
5,314
|
|
1995
|
5,344
|
60
|
5,284
|
|
1996
|
5,306
|
64
|
5,242
|
|
1997**
|
1,033
|
18
|
1,015
|
|
Total
|
49,084
|
586
|
48,498
|
Sources: Live Births, 1987: Vital Statistics Annual Bulletin, 4th Issue (Doha: Central Statistical Organization, June 1988), table 4a, p. 4; 1988-1997: Vital Statistics Annual Bulletin, 14th Issue, 1997 (Central Statistical Organization, June 1998), table 2, p. 5; table 4.1, p. 7; Infant deaths, 1987: Vital Statistics Annual Bulletin, 4th Issue (Doha: Central Statistical Organization, June 1988), table 38, p. 77; 1988-1997: Vital Statistics Annual Bulletin, 14th Issue, 1997 (Doha: Central Statistical Organization, June 1998), table 39, p.123; table 41, p. 128.
Table 4b: Qatari
Nationals Ages 0-10 in 2010
|
Year
|
Number of births
|
Number of infant deaths (0-1)
|
Net increase
|
|
2000*
|
3,743
|
33
|
3,710
|
|
2001
|
6,014
|
53
|
5,961
|
|
2002
|
6,047
|
62
|
5,985
|
|
2003
|
6,312
|
74
|
6,238
|
|
2004
|
6,538
|
45
|
6,493
|
|
2005 (Jan.-Apr.)
|
2,057
|
19
|
2,038
|
|
2005 (May-Dec.)
|
4,203
|
29
|
4,174
|
|
2006
|
6,615
|
55
|
6,560
|
|
2007
|
7,187
|
52
|
7,135
|
|
2008
|
7,621
|
42
|
7,579
|
|
2009
|
7,499
|
53
|
7,446
|
|
2010**
|
2,457
|
13
|
2,444
|
|
Total
|
66,357
|
530
|
65,763
|
Sources: Live Births, 2000: Vital Statistics Annual Bulletin-2000, 17th Issue (Doha: Central Statistical Organization, Apr. 2001), table 4-1, p. 7.; 2001-2004: Vital Statistics Annual Bulletin-2009, 27th Issue (Doha: Qatar Statistics Authority, July 2011), table 3.; 2005: Vital Statistics Annual Bulletin-2005, 22th Issue (Doha: Central Statistical Organization, Sept. 2006), table 7-1, p. 25; table 44, p. 205.; 2006-2009: Vital Statistics Annual Bulletin-2009, 27th Issue (Doha: Qatar Statistics Authority, July 2011), table 3.; 2010: Vital Statistics Annual Bulletin-2010, 26th Issue (Doha: Qatar Statistics Authority, July 2010), table 6-1.; Infant deaths, 2000: Vital Statistics Annual Bulletin-2000, 17th Issue (Doha: Central Statistical Organization, Apr. 2001), table 41, p. 168.; 2001-2009: Vital Statistics Annual Bulletin-2010, 26th Issue (Doha: Qatar Statistics Authority, July 2010), table 53.; 2010: Vital Statistics Annual Bulletin-2010, 26th Issue (Doha: Qatar Statistics Authority, July 2010), table 20.
Table 5: Qatari
Indigenous Population by Age Groups, 2004 & 2010 Censuses
|
Age
group Year
|
0-4
|
5-9
|
10-14
|
15-19
|
20-24
|
25-29
|
30-34
|
35-39
|
40-44
|
45-49
|
50-54
|
55-59
|
60-64
|
65-69
|
70-74
|
75+
|
Total
Qatari population
|
|
2004(c)
|
29,343
|
24,730
|
23,539
|
20,114
|
16,903
|
14,327
|
13,081
|
11,703
|
10,127
|
7,704
|
5,134
|
3,257
|
2,888
|
2,159
|
1,477
|
1,531
|
188,017
|
|
2010(c)
|
35,338(a)
|
30,425(b)
|
28,017
|
47,665
|
35,517
|
27,159
|
19,403
|
9,171
|
7,347
|
240,042
|
|||||||
Sources: 2004, 0-3 age group: Vital Statistics Annual Bulletin-2004, 21th Issue (Doha: Central Statistical Organization, June 2005), table 1.7, p. 26; table 44, p. 208; Vital Statistics Annual Bulletin-2007, 24th Issue (Doha: Qatar Statistics Authority, July 2008), table 5, p. 26; table 44, p. 208; 3 years and above: At-Ta'dad al-'Amm lil-Sukan wal-Masakin-2004 (2004 Census) (Doha: Majlis at-Tahtit, Dec. 2004), table 1, p. 141; table 8, p. 154; 2010, 0-9 age group: Table 4.b.; 10 years and above: The General Census of Population and Housing, and Establishment, Apr.-2010 (Doha: Qatar Statistics Authority, 2010), table 24.
Table 6:
Age-Specific Fertility Rate, Qatari Indigenous Women, 1980-2012
|
Year
Age Group
|
1980
(so)
|
1984
(so)
|
1986
(o)
|
1988
(so)
|
1992
(so)
|
1994
(so)
|
1997
(o)
|
2000
(o)
|
2004
(o)
|
2008
(o)
|
2009
(o)
|
2010
(o)
|
2011
(o)
|
2012
(o)
|
|
15-19
|
151
|
68
|
43
|
66
|
32
|
25
|
14
|
20
|
13
|
12
|
12
|
10
|
8
|
8
|
|
20-24
|
346
|
273
|
213
|
305
|
152
|
157
|
147
|
144
|
129
|
129
|
123
|
115
|
106
|
106
|
|
25-29
|
380
|
336
|
306
|
326
|
223
|
229
|
270
|
244
|
246
|
220
|
212
|
192
|
188
|
188
|
|
30-34
|
310
|
296
|
274
|
234
|
262
|
280
|
290
|
237
|
217
|
209
|
206
|
197
|
187
|
186
|
|
35-39
|
213
|
214
|
188
|
123
|
196
|
227
|
228
|
163
|
166
|
149
|
146
|
138
|
133
|
132
|
|
40-44
|
100
|
108
|
102
|
19
|
66
|
51
|
143
|
61
|
65
|
57
|
55
|
59
|
51
|
51
|
|
45-49
|
45
|
57
|
30
|
8
|
30
|
28
|
65
|
17
|
9
|
5
|
7
|
7
|
6
|
6
|
|
TFR
|
7.7
|
6.8
|
5.8
|
5.4
|
4.8
|
5.0
|
5.8
|
4.4
|
4.2
|
3.9
|
3.8
|
3.6
|
3.4
|
3.4
|
Sources: 1980: ECWA, Demographic Data Sheets, No. 3 (1982), table 2, p.132.; 1984: ESCWA, Demographic Data Sheets, No. 4 (1985), table 2, p. 124.; 1986: Women and Men in the State of Qatar: A Statistical Profile-2006 (Doha: Central Statistical Organization, Apr. 2006), p. 27; 1988: ESCWA, Population Situation-1990, table 9.4, p. 156; 1992: ESCWA, Demographic Data Sheets, No. 7 (1993), table 3, p. 108; 1994: ESCWA, Demographic Data Sheets, No. 8 (1995), table 3, p. 94.; 1997: Women and Men in the State of Qatar: A Statistical Profile-2006 (Doha: Central Statistical Organization, Apr. 2006), p. 27; 2000: Qatar Information Exchange; 2004: Women and Men in the State of Qatar: A Statistical Profile-2006 (Doha: Central Statistical Organization, Apr. 2006), p. 27; 2008-2011: Woman and Man in the State of Qatar: A Statistical Profile-2012 (Doha: Qatar Statistics Authority, 2013), table 1/5, p. 16.; 2012: Qatar Information Exchange. Available at: http://www.qix.gov.qa.
Appendix A:
Research Methodology
The research for this article is mainly derived from two kinds of sources:(a) Official Qatari data, which includes two types of materials. The first is the five censuses which Qatari authorities implemented, beginning in April 1970 and most recently in April 2010.
The second is drawn from the Qatari civil registration system and ongoing demographic and health statistical publications. Although Qatar implemented its first census in 1970, it did not have an accurate system of vital demographic registration until the early 1980s. In 1980, the Central Statistical Organization (CSO) was established and, in 1998, it was integrated into the Planning Council. In June 2007, the Statistics Authority (QSA) was established as a new independent governmental agency.
(b) ECWA/ESCWA publications. The U.N. Economic Commission for Western Asia (ECWA) was established in 1973. In 1985, the name of the organization was changed to the U.N. Economic and Social Commission for Western Asia. The data provided by ECWA and ESCWA since the early 1980s is quite detailed. In addition to providing the total number of Qatari citizens according to sex and age groups, it covers a wide range of other demographic parameters such as the crude birth and death rates, age-specific fertility rates, and in some years, even the scale and structure of the indigenous workforce. However, in many cases, the estimates provided by ECWA/ESCWA were not accurate, and in some instances, there was quite a substantial gap between the data it provided and the estimates from our research on the number of the Qatari nationals.
The "accuracy hierarchy" supposition on which this research is based is that since the mid-1980s, the most reliable data is that published by the Qatari authorities themselves, followed by that published by ECWA/ESCWA. Unofficial estimates have been credited with little accuracy as their research methodology was not specified. This article did not use any data from the World Bank or the CIA, as the demographic data published by both organizations lumps the Qatari nationals and the foreign population into one group without any distinction between them.
In light of the above-mentioned accuracy hierarchy, the Qatari official data served as a "fulcrum" on which the calculated estimates were based regarding both the total number of Qatari citizens and their natural increase. In many cases, ECWA/ESCWA's data serve either to check the probability of the Qatari official data or as a supplement to Qatari partial official data.
[2] Jure Snoj, "Population of Qatar," bq magazine (Doha), Dec. 18, 2013.
[3] "History of Census in Qatar," Qatar Statistics Authority, Doha, accessed Jan. 15, 2015.
[4] Allen J. Fromherz, Qatar: A Modern History (London and New York: I.B. Tauris, 2012), p. 1.
[5] Population and Development, Issue No. 6: Development Policy Implication of Age-Structure Transitions in Arab Countries (New York: U.N. Economic and Social Commission for Western Asia, 2013), annex I, table 1, p. 67; The Population Situation in the ECWA Region-Qatar (Beirut: U.N. Economic Commission for Western Asia, 1980), p. 8.
[6] N.B. Hudson, The First Population Census of Qatar, April/May 1970 (Beirut: British Embassy in Beirut, Middle East Development Division, Oct. 1970), p. 17.
[7] Ibid., pp. 3-4.
[8] J.S. Birks and C.A. Sinclair, Country Case Study: The State of Qatar, International Migration Project, (Durham: University of Durham, Feb. 1978).
[9] Women and Men in the State of Qatar: A Statistical Profile-2006 (Doha: Central Statistical Organization, Apr. 2006), table 1/4, p. 96.
[10] Ibid.
[11] Ibid.
[12] At-Ta'dad al-Amm li-l-Sukan wa-l-Masakin-March 1997 (Doha: Majlis at-Tahtit, Feb. 1999), table 13, p. 65.
[13] The natural increase between the two censuses included the natural increase growth for the period of Mar.-Dec. 1986, the whole period of 1987-1996 and that of Jan., Feb., and half of Mar. 1997 since the census was implemented on Mar. 16.
[14] According to the 1997 census data, the age group of 15-65 represented 51.3 percent among the males but 54.5 percent among the females. See Women and Men in the State of Qatar, p. 16.
[15] At-Ta'dad al-Amm li-l-Sukan wa-l-Masakin-March 2004 (Doha: Majlis at-Tahtit, Dec. 2004), table 1, p. 141, table 8, p. 154.
[16] Vital Statistics Annual Bulletin-2010, 26th issue (Doha: Qatar Statistics Authority, July 2010), table 10, p. 29, table 53, p. 201.
[17] The natural increase growth between the 1997 and the 2004 censuses was calculated as follows: half of the natural increase in March 1997 plus the whole natural increase of the rest of that year; the natural increase of the whole period of 1998-2003; and the natural increase of Jan., Feb., and half of Mar. 2004.
[18] Census of Population and Housing, and Establishment, April-2010 (Doha: Qatar Statistics Authority, 2010), table 24, p. 91.
[19] The natural increase growth between the two censuses was calculated as follows: half of the natural increase in Mar. 2004 plus the whole natural increase of the rest of that year; the natural increase of the whole period of 2005-09; and the natural increase of Jan.-Mar. and two-thirds of Apr. 2010.
[20] Since there is no available data for the age group of 55-59 each year, the total population of this age group was divided by 5 (since this cohort contains 5 years) and multiplied by 4 (since only 4 not 5 years are needed for the comparison), thus producing 2,606 people for the age group of 55-58.
[21] At-Ta'dad al-Amm li-l-Sukan wa-l-Masakin-March 2004, table 1, p. 141, table 8, p. 154.
[22] Census of Population and Housing, and Establishment, April-2010, table 14; Summary Results of 2010 Population, Housing and Establishments Census (Doha: Qatar Statistics Authority, 2010), table 2-1, p. 11.
[23] See Gianluca P. Parolin, Citizenship in the Arab World: Kin, Religion and Nation-State (Amsterdam: Amsterdam University Press, 2009), p. 116; Gulf News (Dubai), Apr. 3, 2005.
[24] Baquer Salman al-Najjar, "Population Policies in the Countries of the Gulf Co-operation Council," in Abbas Abdelkarim, ed., Change and Development in the Gulf (London: Macmillan Press and New York: St. Martin's Press, 1999), pp. 138-9.
[25] Nasra M. Shah, "The Management of Irregular Migration and Its Consequence for Development: Gulf Cooperation Council," ILO Working Papers, International Labour Organization, Regional Office for Asia and the Pacific, Bangkok, Mar. 2009, p. 8.
[26] See, for example, Philippe Fargues, "Immigration without Inclusion: Non-Nationals in Nation-building in the Gulf States," Asian and Pacific Migration Journal, no. 3-4 (2011), p. 273.
[27] Law No. 38 of 2005 on the acquisition of Qatari nationality, 38/2005, Qatar Legal Portal (al-Meezan); Zahra R. Babar, "Citizenship Construction in the State of Qatar," Middle East Journal, Summer 2014, pp. 411-3; Gulf News, June 6, 2006.
[28] Financial Times, Oct. 24, 2010.
[29] Asharq al-Awsat (London), Sept. 18, 2014; Justin Gengler, "Bahrain Drain: Why the King's Sunni Supporters are Moving Abroad," Foreign Affairs, Sept. 5, 2014.
[30] Statistical Abstract of the Region of the Economic Commission for Western Asia, 1970-1979, 4th issue (Beirut: U.N. Economic Commission for Western Asia, 1981), table 1-2, p. 174.
[31] Demographic and Related Socio-economic Data Sheets for Countries of the ECWA, no. 3 (Beirut: U.N. Economic Commission for Western Asia, May 1982), tables 2, 3, pp. 132-3.
[32] "World Population Policies-Qatar," Population Studies, no. 102, vol. 3, U.N. Department of International Economic and Social Affairs, New York, 1990, pp. 39-40.
[33] "Labor Force Sample Survey-2011," Qatar Statistics Authority, Doha, Nov. 2011, pp. 11-2, 14.
[34] For comparison, see Onn Winckler, Arab Political Demography: Population Growth, Labor Migration and Natalist Policies (Brighton and Portland: Sussex Academic Press, 2009), table 2.4, pp. 62-3.
[35] Bulletin on Population and Vital Statistics in the Arab Region, no. 16 (New York: U.N. Social and Economic Commission for Western Asia, 2013), table 77, p. 102.
[36] The State of Qatar's Population Policy (Doha: Permanent Population Committee, Oct. 2009), p. 13.
[37] Annual Report-2011 (Doha: Permanent Population Committee, Jan. 2012), p. 8.
[38] The State of Qatar's Population Policy, p. 13.
[39] World Population Projections, 1994-95 Edition, The World Bank (Baltimore and London: John Hopkins University Press, 1995), p. 442.
[40] World Population to 2030 (New York: U.N. Dept. of Economic and Social Affairs, Population Division, 2004), table A11, p. 200.
[41] "Qatar," International Data Base, U.S. Census bureau, Dec. 2013.
[42] Claude Berrebi, Francisco Martorell, and Jeffery C. Tanner, "Qatar's Labor Market at a Crucial Crossroad," Middle East Journal, Summer 2009, p. 429.
[43] Annual Abstract-2014 (Doha: Qatar Statistics Authority, 2014), table 5.
[44] "Qatar: 2012 Article IV Consultation," IMF Country Report No. 12/18, International Monetary Fund, Washington, D.C., Jan. 2012, table 1, p. 27.
[45] "Qatar Economic Insight-2013," Qatar National Bank, Doha, Nov. 2013, p. 2.
[46] For a detailed methodological examination of the various demographic sources used in the article, see Appendix A.
To subscribe to the MEF mailing lists, go to http://www.meforum.org/list_subscribe.php


No comments:
Post a Comment